Invest Now. Save even more later.
Implementing a graphics management system is a significant investment. It can also offer you an opportunity for substantial returns. The BLUE Savings Calculator can help you get the topline numbers on how much you can save by implementing BLUE Workflow Software as a Service. We’ll even send you a high-level workflow software savings report that can be easily inserted into a presentation for sharing with decision makers.
Looking for full ROI analysis? Contact us for a one-on-one BLUE workflow software consultation.
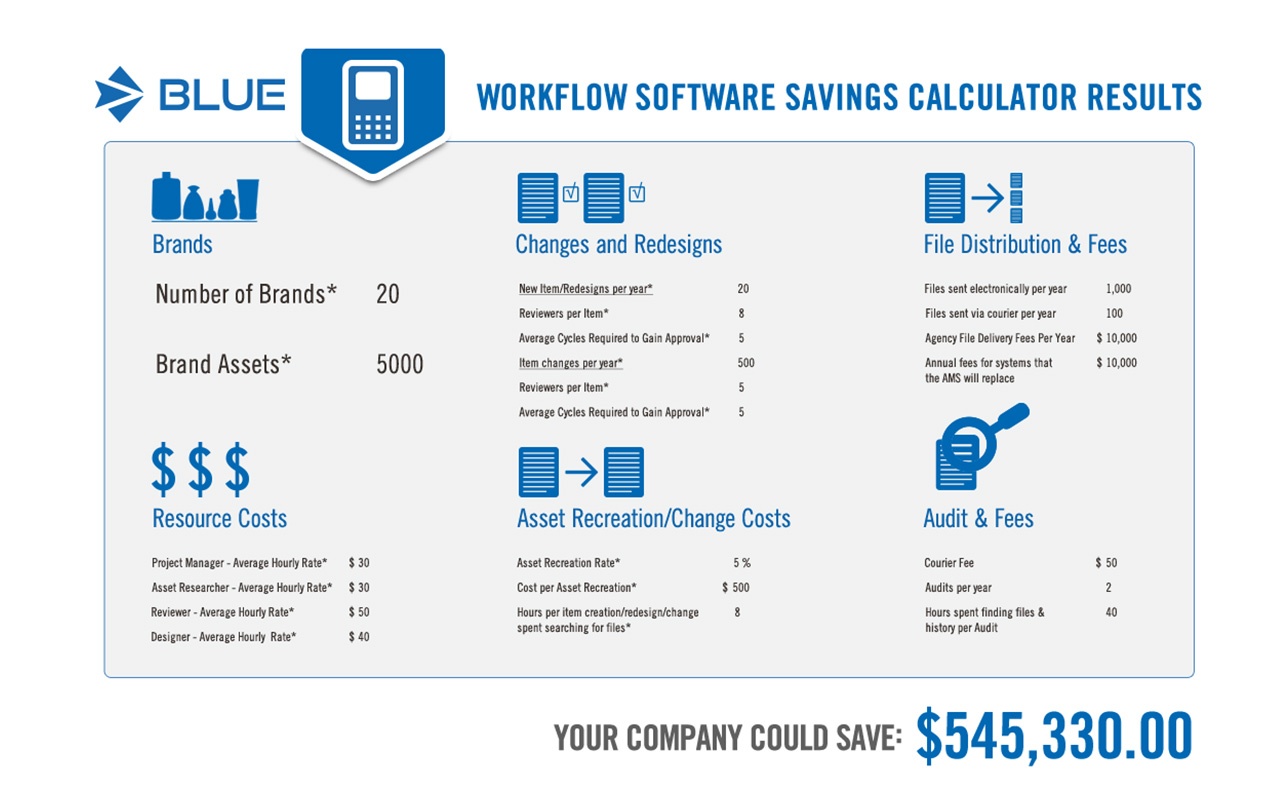
What you’ll need for the most detailed savings calculation.
Brands & Assets
How many brands will be managed in the graphics management system and how many assets are related to each brand? Such as the number of unique outputs, like SKUs, components or marketing material.
Changes & Redesigns
How many changes to existing items occur per year and how many new items or redesigns occur per year? How many users are involved in the review process and how many times are new and existing items viewed before approval?
File Distribution & Fees
How many files are sent electronically and/or via courier per year? And what are your agency fees for distribution of files per year of both approved and in-progress work?
Resources
What are the average hourly rates for people managing new item creation, redesigns and change activities? Also, what are the average hourly rates for those who search assets, review artwork and design/revise artwork?
Asset Recreation
What percentage of content is recreated due to a lost or incorrectly versioned original? Plus, what’s the cost of recreating an asset, and hours spent searching for files per item recreation?
Audits
How many audits are required for released items or assets, and how much time is spent finding the history of a file when an audit occurs?
 Click here to view a sample savings report.